1 Open the dashboard
Click Dashboard in the top menu bar. The page keeps Status highlighted because the dashboard belongs to the Status group.

Each dashboard is a tab. Click a tab name to show that dashboard. Its graphs are loaded below the tabs.
2 Set the dashboard collections
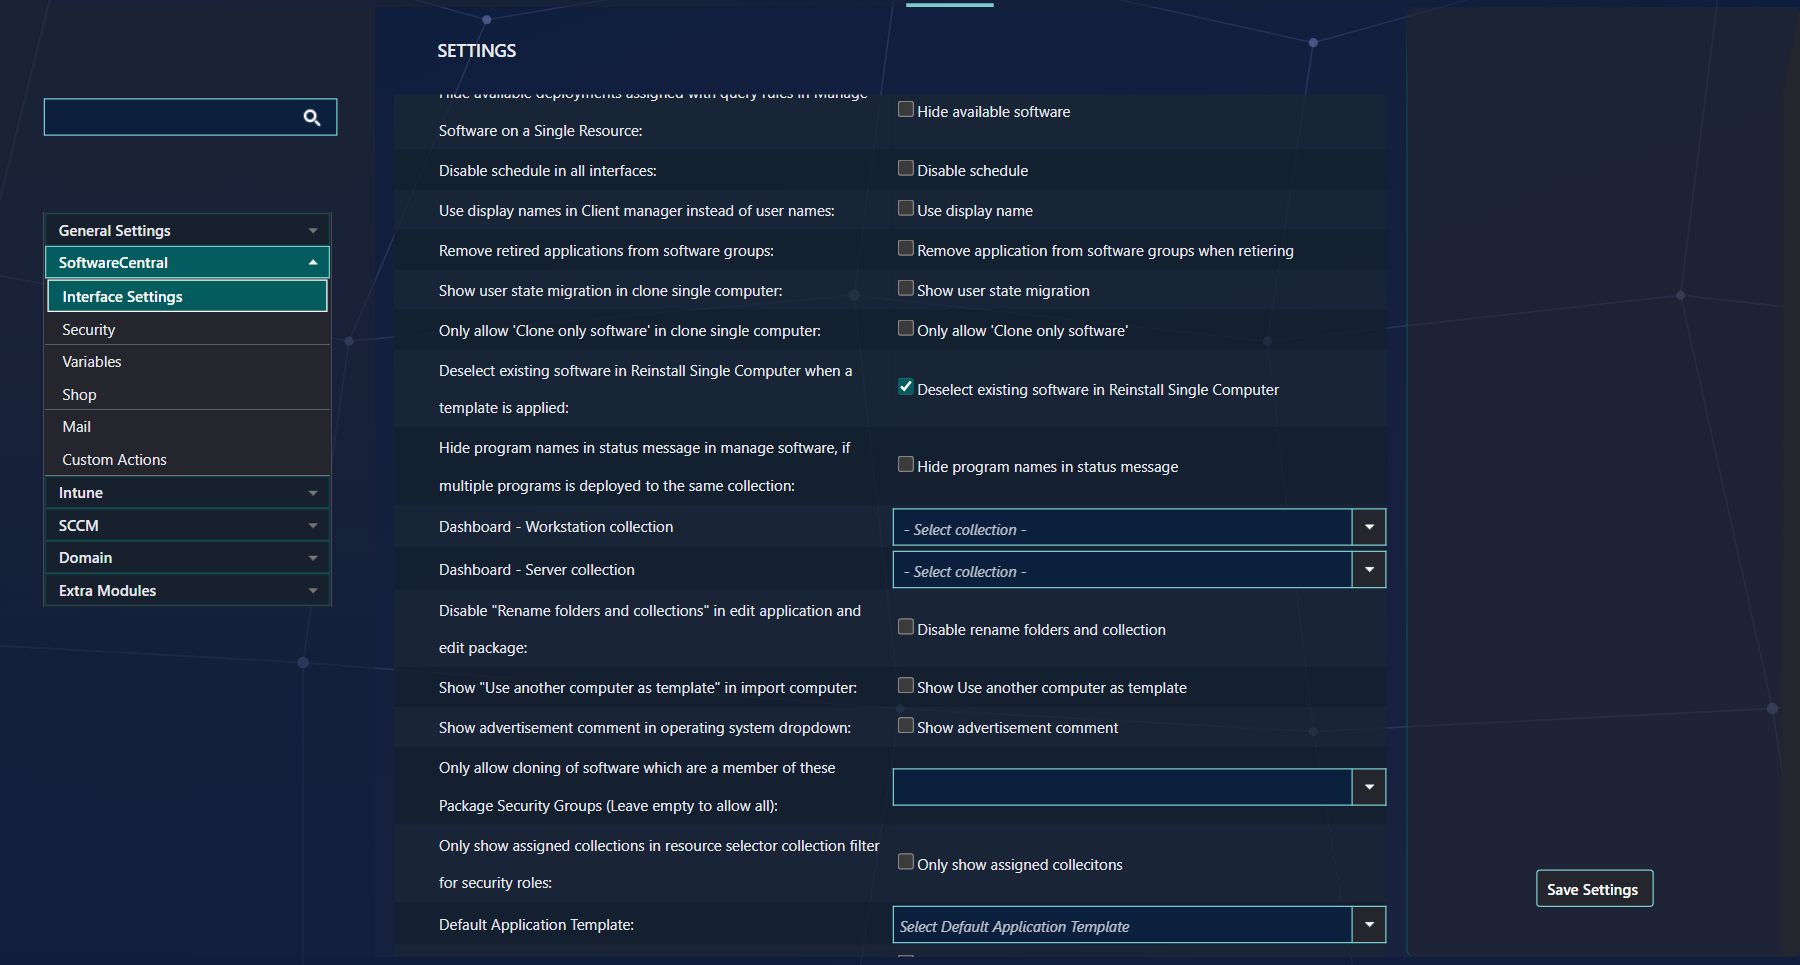
Two graphs use collections that you choose in the settings. Set them before you build your dashboards.
Go to Settings › SoftwareCentral › Interface Settings. Under this group, choose:
| Setting | What it is used for |
|---|---|
| Dashboard - Workstation collection | The collection of workstations that the workstation graphs read from. |
| Dashboard - Server collection | The collection of servers that the server graphs read from. |
3 Interface overview
The page has a left menu, the dashboard in the middle, and an editing panel on the right.
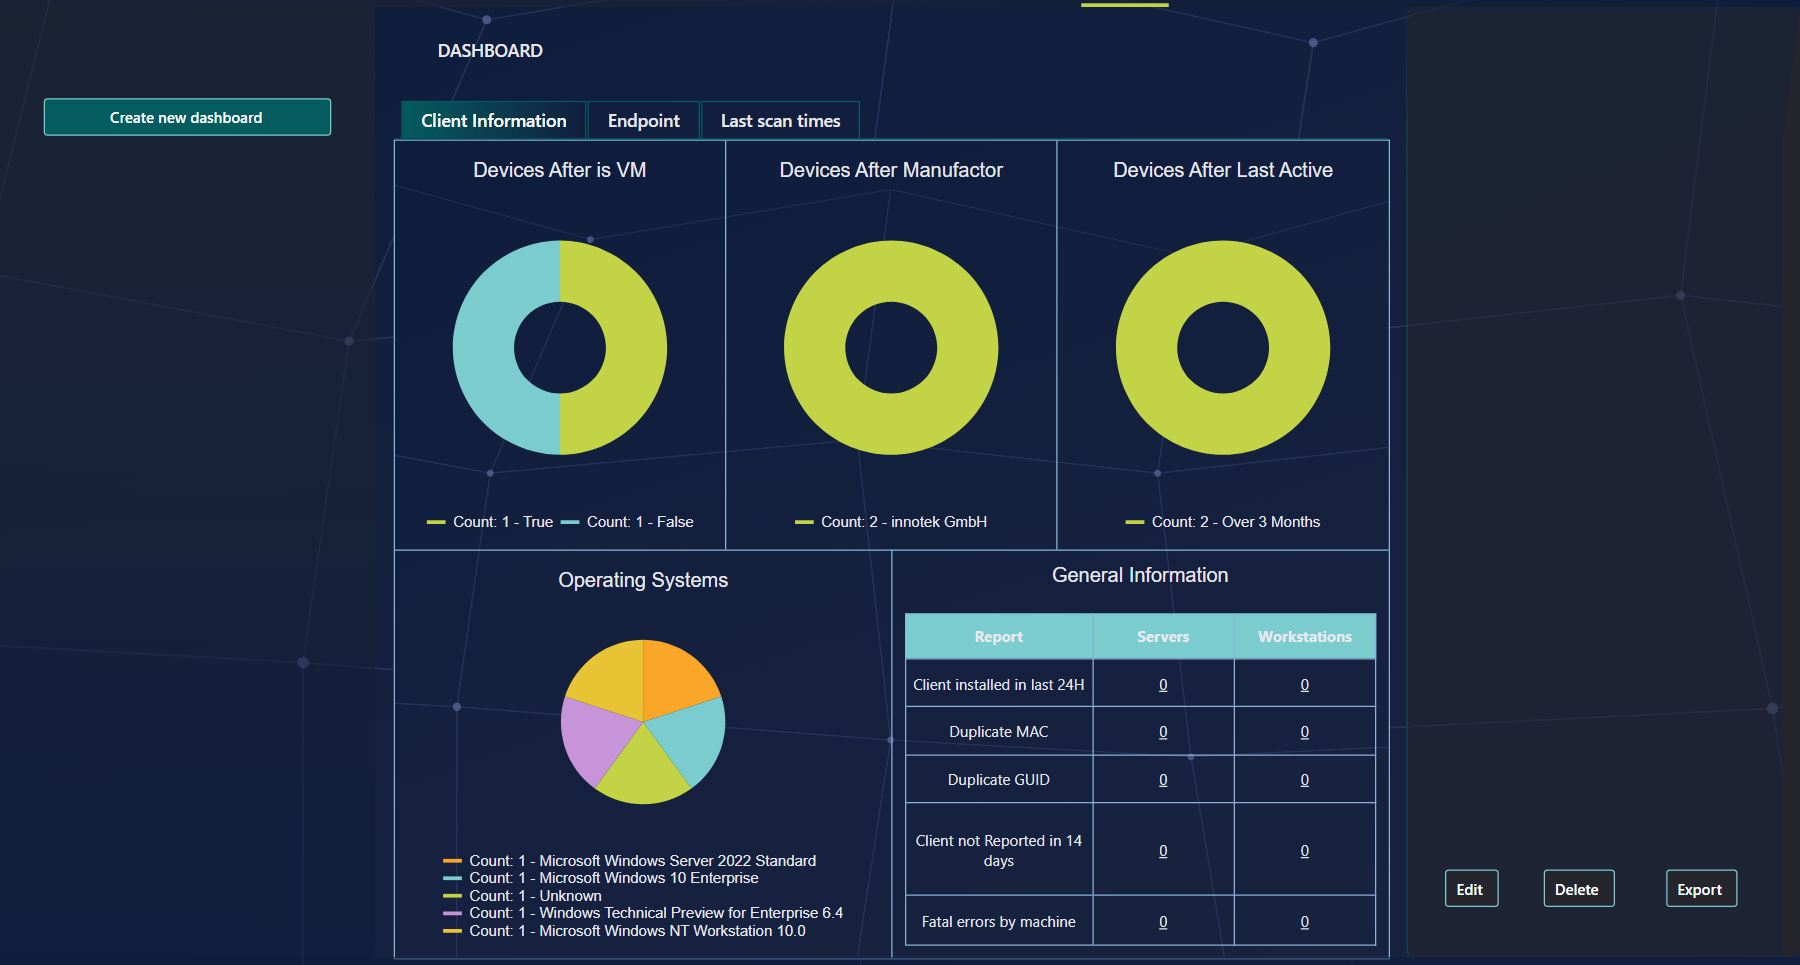
| Button | What it does | Shown when |
|---|---|---|
| Create new dashboard | Starts a new dashboard with an empty editing panel. | Your role has the CreateDashboard menu button. |
| Edit | Opens the editing panel for the selected dashboard. The button then reads Save, and Delete reads Cancel. | Your role has the EditDashboard menu button. |
| Delete | Opens a confirmation window for the selected dashboard. | Your role has the DeleteDashboard menu button. |
| Export | Exports the selected dashboard to PDF (tooltip: Export to PDF). | Always, when there is a dashboard. |
Each dashboard can contain a maximum of 6 graphs or grids. The dashboard adapts to the number of graphs and to the size of the browser window.
4 Filter a graph
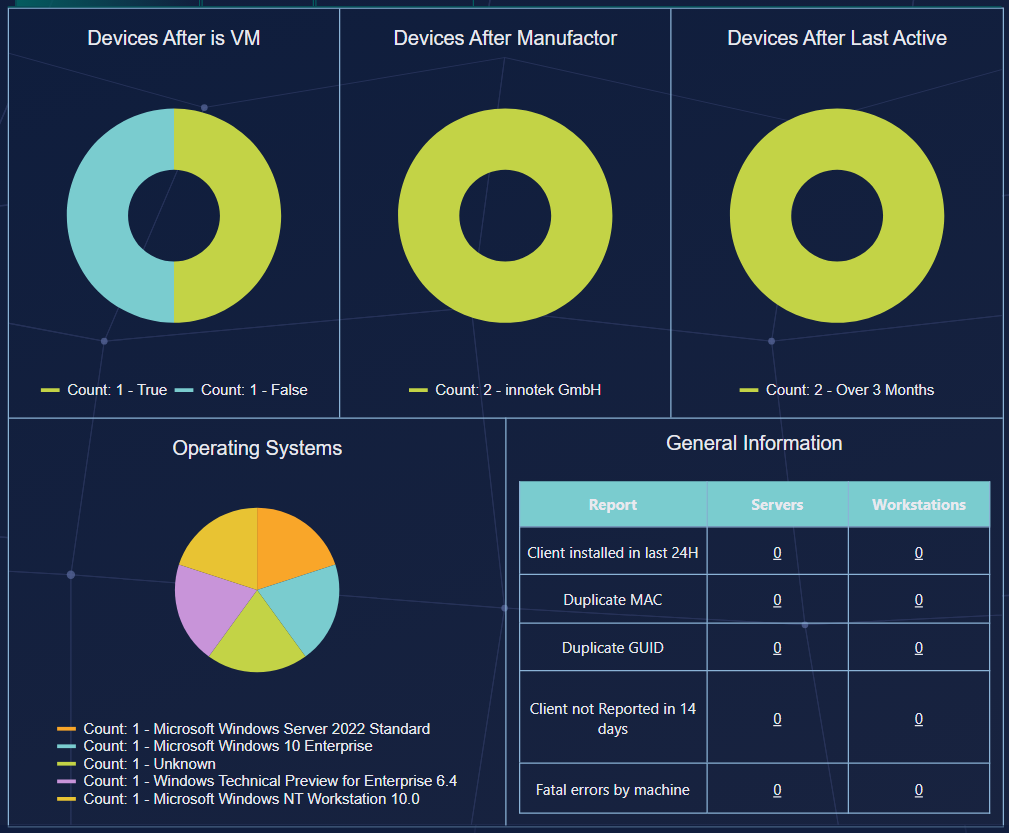
Use the legend under a graph to hide the labels that hold most of the data.
5 Detailed information
Click a part of a graph, or a row in a grid, to see the devices behind it.
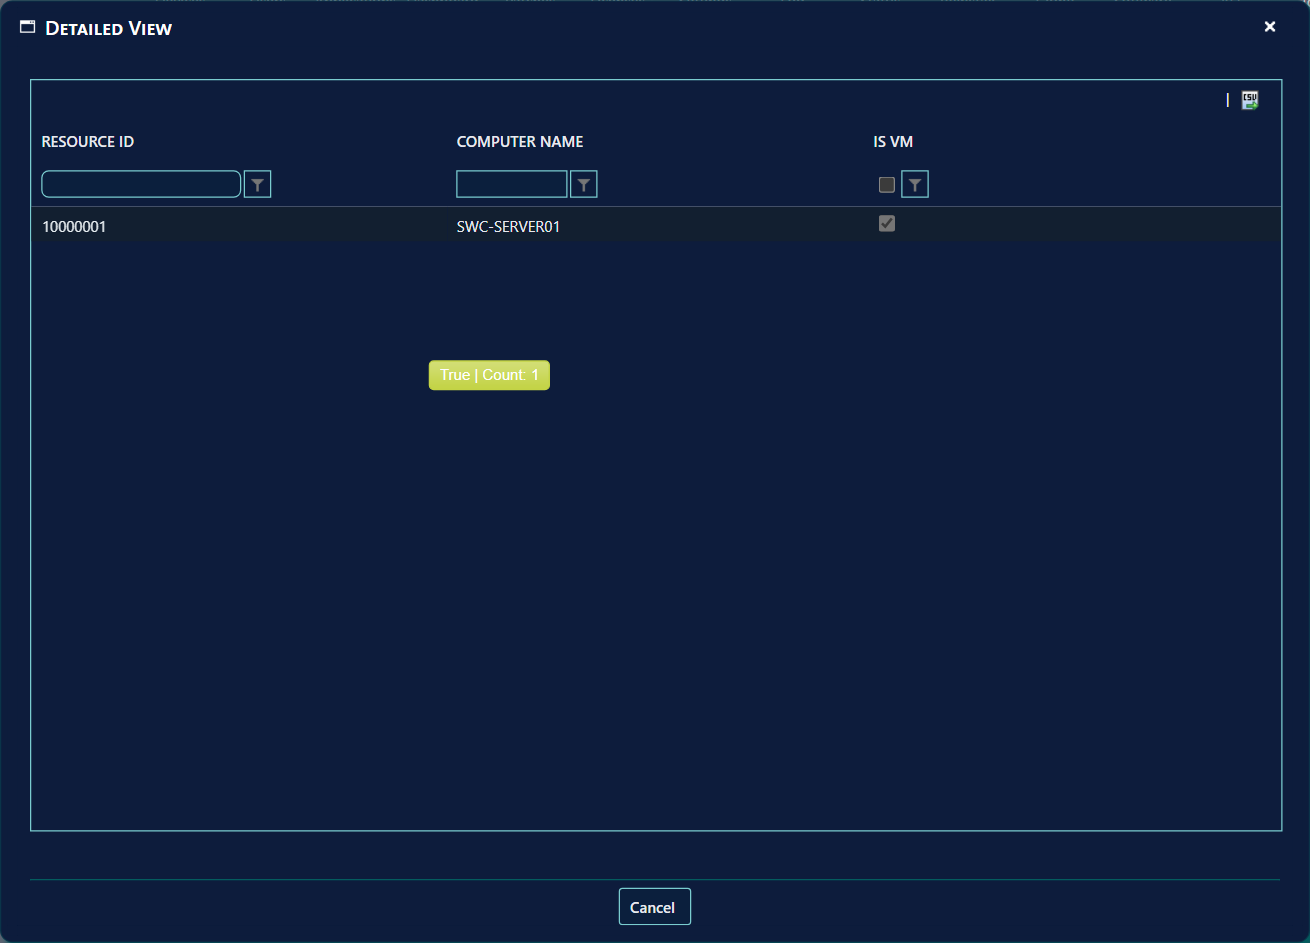
The window has a CSV export button in its top right corner. Use it to take the data into a spreadsheet for further investigation.
6 Create a dashboard
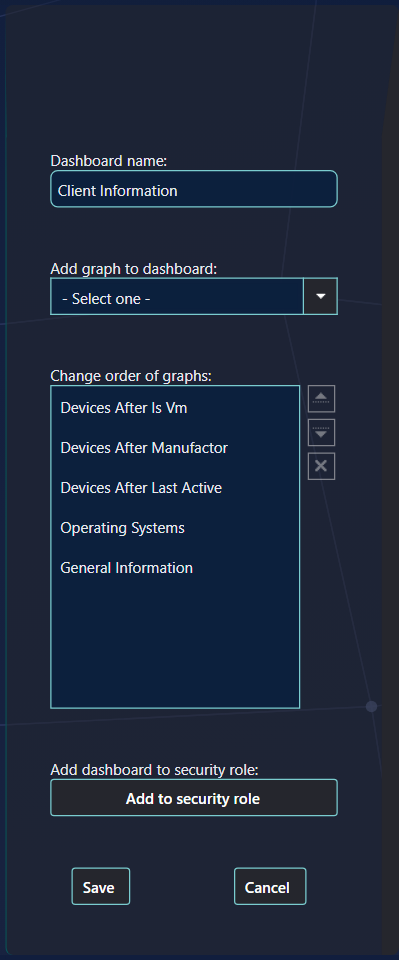
Click Create new dashboard. A new tab is added and the editing panel opens on the right.
- Type a name in Dashboard name. The name can be up to 60 characters.
- Choose a graph or grid in Add graph to dashboard. The drop-down can be filtered by typing. Each graph you choose is added to the list Change order of graphs.
- Repeat step 2 for each graph, up to six.
- Put the graphs in order with the up and down arrows beside the list, or by dragging them. Remove a graph with the X beside it.
- Set the security roles (see Security roles), then press Save.
7 Dashboard variables
Some graphs need one more value before they can be added. The value is chosen in a small window.
When you choose such a graph, the window Select dashboard variabel opens. Select the value and press Save Dashboard. The graph is then added to the list.

To change the value of an item later, click the small icon at the right of the item in the list (tooltip Change variabel). The same window opens, and you can choose another value.

8 Security roles
Choose which security roles can see a dashboard.
- In the editing panel, press Add to security role. The window Select security roles opens with a list of all security roles.
- Tick the roles that should see the dashboard.
- Press Save Security Roles. Then press Save on the dashboard.
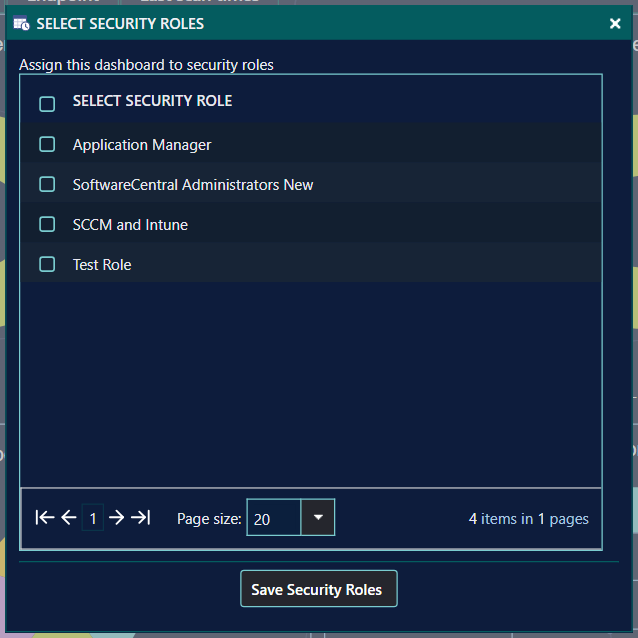
A dashboard that has no role ticked is visible to every security role. A dashboard with one or more roles ticked is visible to those roles only.
9 Edit a dashboard
Click the dashboard's tab, then press Edit in the lower right corner.
The editing panel opens as in Create a dashboard. The button Edit becomes Save, and Delete becomes Cancel. Press Save to keep your changes, or Cancel to leave the dashboard unchanged.
10 Delete a dashboard
Click the dashboard's tab, then press Delete in the lower right corner.
A confirmation window opens and asks whether you want to delete the dashboard. Press Delete in that window to delete it, or Cancel to keep it.
11 Best practice
- Set the two dashboard collections first. Without them, the workstation and server graphs cannot show data (see the troubleshooting table).
- Limit a dashboard to the roles that need it. A dashboard with no role ticked is visible to every role, so tick a role whenever the data should be restricted.
- Give the three dashboard buttons only to the roles that manage dashboards. Create new dashboard, Edit and Delete are hidden from a role that does not have their menu button.
- Keep dashboards focused. Six graphs is the limit; a second dashboard for another audience is easier to read than a crowded one.
- Use the detail view before you act. Open the Detailed View window and export its CSV to check the devices behind a figure first.
12 Troubleshooting
| Symptom | Cause | What to do |
|---|---|---|
| Tooltip Collection missing, go to the settings menu and select a dashboard workstation colelction (the spelling is as shown) | No collection is set for Dashboard - Workstation collection. | Go to Settings › SoftwareCentral › Interface Settings, select the collection and press Save Settings. |
| Tooltip Collection missing, go to the settings menu and select a dashboard server colelction | No collection is set for Dashboard - Server collection. | Set Dashboard - Server collection in the same place. |
| Maximum 6 elements per dashboard | The list already has six graphs. | Remove a graph with its X, then add the new one. |
| Name is missing | The Dashboard name box is empty when you press Save. | Type a name of up to 60 characters. |
| Pressing Save does nothing and no message appears | The list of graphs is empty. | Add at least one graph, then press Save again. |
| The Edit, Delete or Create new dashboard button is missing | Your security role does not have the matching menu button. | Ask an administrator to give your role the button in the menu-button setting. |
| A dashboard is missing from the tabs for a user | The dashboard has security roles ticked, and the user's role is not one of them. | An editor adds the user's role in Add to security role, or unticks all roles so the dashboard is visible to every role. |