1 Find a deployment
All your deployments are listed on the Deployments tab of the Deployment Manager. Click View on a row to open the monitor for that deployment in a new window.
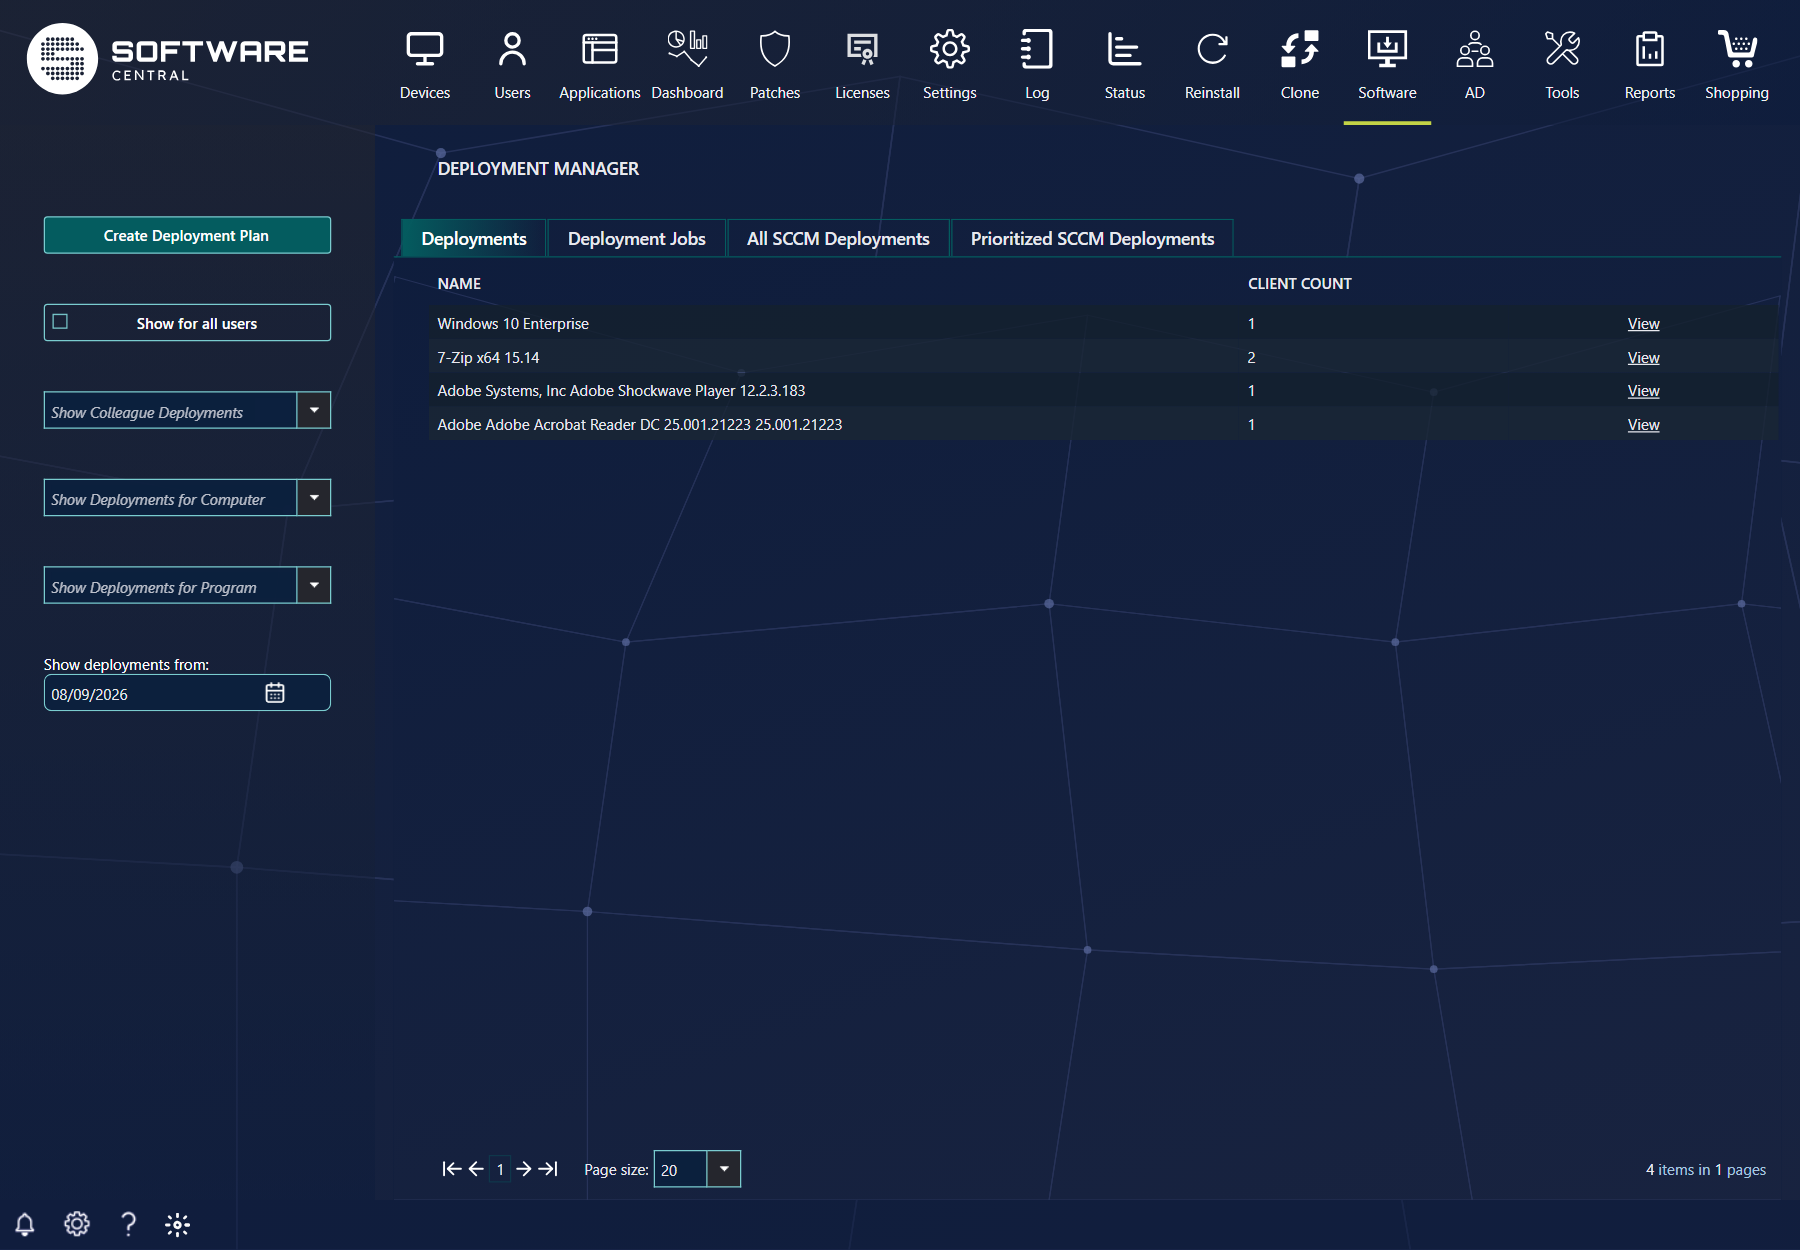
You can open the monitor immediately after a deployment has been created.
2 The monitor in the corner
The lower-left corner of the screen has a Show Deployment Monitor button. It opens a short list of recent deployments. The button is shown to users who have the Deployment Manager, when the Enable Deployment Monitor setting is on.
| Control | What it does |
|---|---|
| Today, Yesterday, Last Week | Choose the period of deployments the list shows. Only one can be selected at a time. |
| View All | Opens the Deployment Manager. |
| Refresh | Reloads the list. |
| Automatically show the Deployment Monitor. | A tick box in the notification settings. When it is ticked, the monitor opens when a new deployment is started. It is saved in a cookie in your browser. |
Your administrator sets the two Deployment Monitor options in Settings: Enable Deployment Monitor, and Open Deployment Monitor for opening the monitor when a deployment is added. See Deployment Manager Configuration.
3 Deployment start times
The time it takes a deployment to start will differ from time to time.
Deployments of 1 to 10 computers will normally start within 2-15 minutes. Deployments to more than 10 computers will normally start within an hour.
4 The monitor window
The window lists the computers in the deployment, with the status of each one. The examples on this page follow a deployment of Notepad++ to 7 computers, and then a deployment of VideoLAN VLC media player to 2 computers.

The example is opened right after the deployment was created. LAPTOP-0143 is reported as Status unknown, which can mean the computer is offline, so it will most likely not be installed there. LAPTOP-0145 is flagged as Successfully installed, because it already had Notepad++ installed.
Filter by software
At the top of the window is the drop-down box Filter by software. If you deployed more than one program in your deployment, you can see the status for each program using this drop-down box.
Filter by status
To the right of the drop-down there are four buttons. All four are selected by default, so all computers are shown. Clear a button to hide the computers in its group.
| Button | Computers in the group |
|---|---|
| Show Succeeded | Succeeded (status 1000 to 1999). |
| Show in Progress | In progress (status 2000 to 2999). |
| Show Failed | Error (5000 to 5999), Requirements Not Met (3000 to 3999), not a member of the collection (10000), insufficient licences (10001) and resource does not exist (10004). |
| Show Unknown | Unknown (4000 to 4999), no status received (-1) and computer offline with no status from Configuration Manager (10002). |
The window also shows the number of computers in each of the four groups: Success, In progress, Failed and Unknown. A computer that has not started yet is not counted in these four numbers.
5 Refresh and export
Above the list there is a Refresh link, and three icon buttons used to export the computers and their status messages.

Refresh reloads the status for all computers in the deployment.
The export options are:
- Export to Excel
- Export to PDF
- Export to CSV. Note that the CSV export does not include the status messages. You can export a CSV file and create a new deployment from it using the Upload CSV file filter in the Deployment Manager.
6 Status messages
The status changes as the client reports back. Click Refresh to see the latest status.

Here we can see that most computers have succeeded.

If we click Refresh again, we see that the installation has started on LAPTOP-0142.

The status messages are read from the status the client reports. The main groups are:
| Message starts with | Meaning |
|---|---|
| Application completed with success | The program is installed. For example, Already Compliant is added when the program was already installed. |
| In Progress | The client is working on it. For example, Installing or Waiting for content is added. |
| Requirements Not Met | The computer does not meet the requirements of the program. It is counted under Failed. |
| Unknown | No recent status is known for the computer. It is counted under Unknown. |
| Error | The program failed on the client. For example, Deployment failed is added. It is counted under Failed. |
| No messages have been received | The client has not reported a status yet. |
7 Client log
To see what the client did, click the Show client log icon on the row. The icon is a page with lines of text. It opens a new window.

Another window will open. This window displays information gathered from the client computer. To help you find relevant information, SoftwareCentral only displays log data relevant to the current deployment.

From the log in this example, we can see that the installation is in progress, just as the monitor said.
When you close the log and refresh the monitor, the installation is shown as completed on LAPTOP-0142:

If you open the log again, you will also see that it says the installation was completed.

8 Failed deployments
Here is another example, where a program was deployed to 2 computers.

The first computer, LAPTOP-0142, says that the installation failed. Open its client log to see what went wrong.

9 Mark as succeeded
If you have verified that a deployment was successful, even though the monitor and Configuration Manager say otherwise, click the green check mark on the row. The tooltip reads Mark as succeeded.

A window opens and asks you to confirm. Its text reads: If this deployment has succeeded even though the system has marked it as failed, then click OK to mark it as succeeded. This action cannot be undone.

Note that marking a deployment as succeeded does not change anything in Configuration Manager. It only changes the status shown for that computer in your deployment.

10 Fix a failed deployment
The blue button next to the status message tries to fix that computer. What it does depends on the status.

| Status | What the button does | Message shown |
|---|---|---|
| Unknown | Refreshes the machine policy and repairs the application on the client. | Trying to start deployment |
| Error | Refreshes the machine policy. For an application it starts the application evaluation cycle on the client; for a package it reruns the advertisement. | Trying to restart deployment |
| Not a member of the collection | Adds the computer to the install collection and deploys to it again. The tooltip reads If possible, add the computer to the collection. For an operating system deployment the fix works only when the collection belongs to a software group; otherwise the message below is shown. | Trying to add computer to collection, or Can not redeploy to and OSD collection |
| Offline, with no status from Configuration Manager | Sends a Wake-On-Lan packet to each network address of the computer. The tooltip reads Try to turn on the computer using Wake-On-Lan. | Trying to turn on the device, or Failed to turn on the device |
| Succeeded, In progress, Requirements Not Met | Nothing to repair. The button is not used. | Nothing to repair here |
In our example, the computer was not a member of the install collection, so the button tries to add it:

After the computer has been added to the collection, the installation starts:

Rerun failed
The window also has a Rerun failed button. Its tooltip reads: Let SoftwareCentral try to fix missing collection memberships and notify failed client to request a policy. Close closes the window.
11 Best practice
- Read the status before you act. Use the filters to show only Show Failed or Show Unknown, read the client log for each computer, and then fix the computers one at a time.
- Mark as succeeded only after you have checked the computer. The change is made in SoftwareCentral only. Configuration Manager is not changed.
- Use Rerun failed when the list is right. It fixes missing collection memberships and asks the failed computers to request a policy. Check the list first.
- Know which computers can be woken. The Wake-On-Lan fix needs the computer's network addresses. Without them, the fix reports Failed to turn on the device.
12 Troubleshooting
| Symptom | Cause | What to do |
|---|---|---|
| A message "Failed to initialize interface." with an access error appears in Notifications, and the monitor is empty | SoftwareCentral cannot read the deployment status from Configuration Manager. | Check the Configuration Manager settings in Deployment Manager Configuration. If the monitor stays empty, contact your administrator. |
| The fix shows "Failed to turn on the device" | No network address is known for the computer, so no Wake-On-Lan packet can be sent. | Check that the computer reports its network addresses to Configuration Manager, then try again. |
| The fix shows "Can not redeploy to and OSD collection" | The deployment uses an operating system collection, which the monitor cannot redeploy. | Deploy the operating system again from the Deployment Plan. |
| The fix shows "Unable to repair this deployment" | The status has no repair action. | Read the client log, then redeploy from the Deployment Manager. |
| The fix shows "Nothing to repair here" | The computer is succeeded, in progress or requirements not met. | No action is needed. For requirements not met, check the requirements of the program. |