1 Role selector
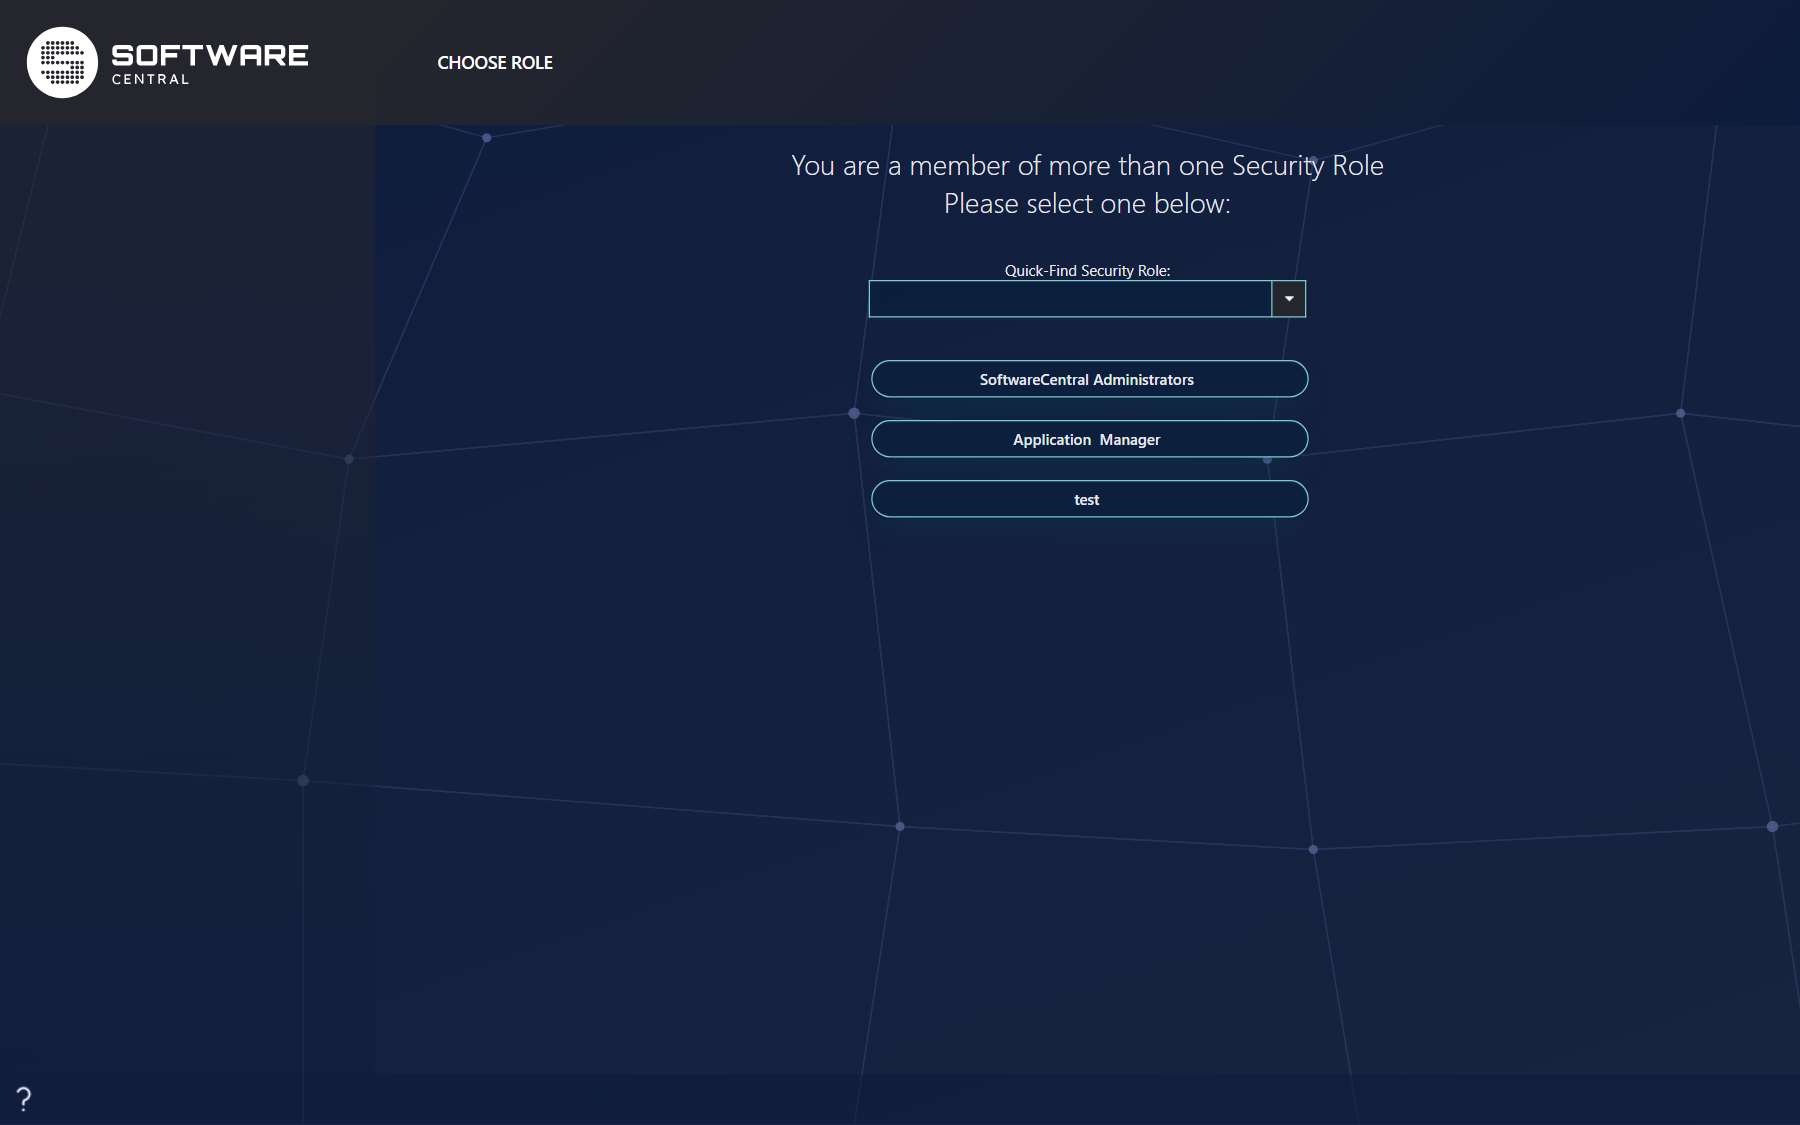
If you are a member of more than one security role, you will be presented with the role selector each time you launch SoftwareCentral.
The role selector gives you a list of all the roles you are a member of. Click on the role you wish to use to log into SoftwareCentral.
You may also use the search box, Quick-Find Security Role, to find a role. The search box is highlighted when you come to the role selector page, so you can start typing immediately to find the correct role. Click on enter to load the selected role in the search box.
2 Main interface
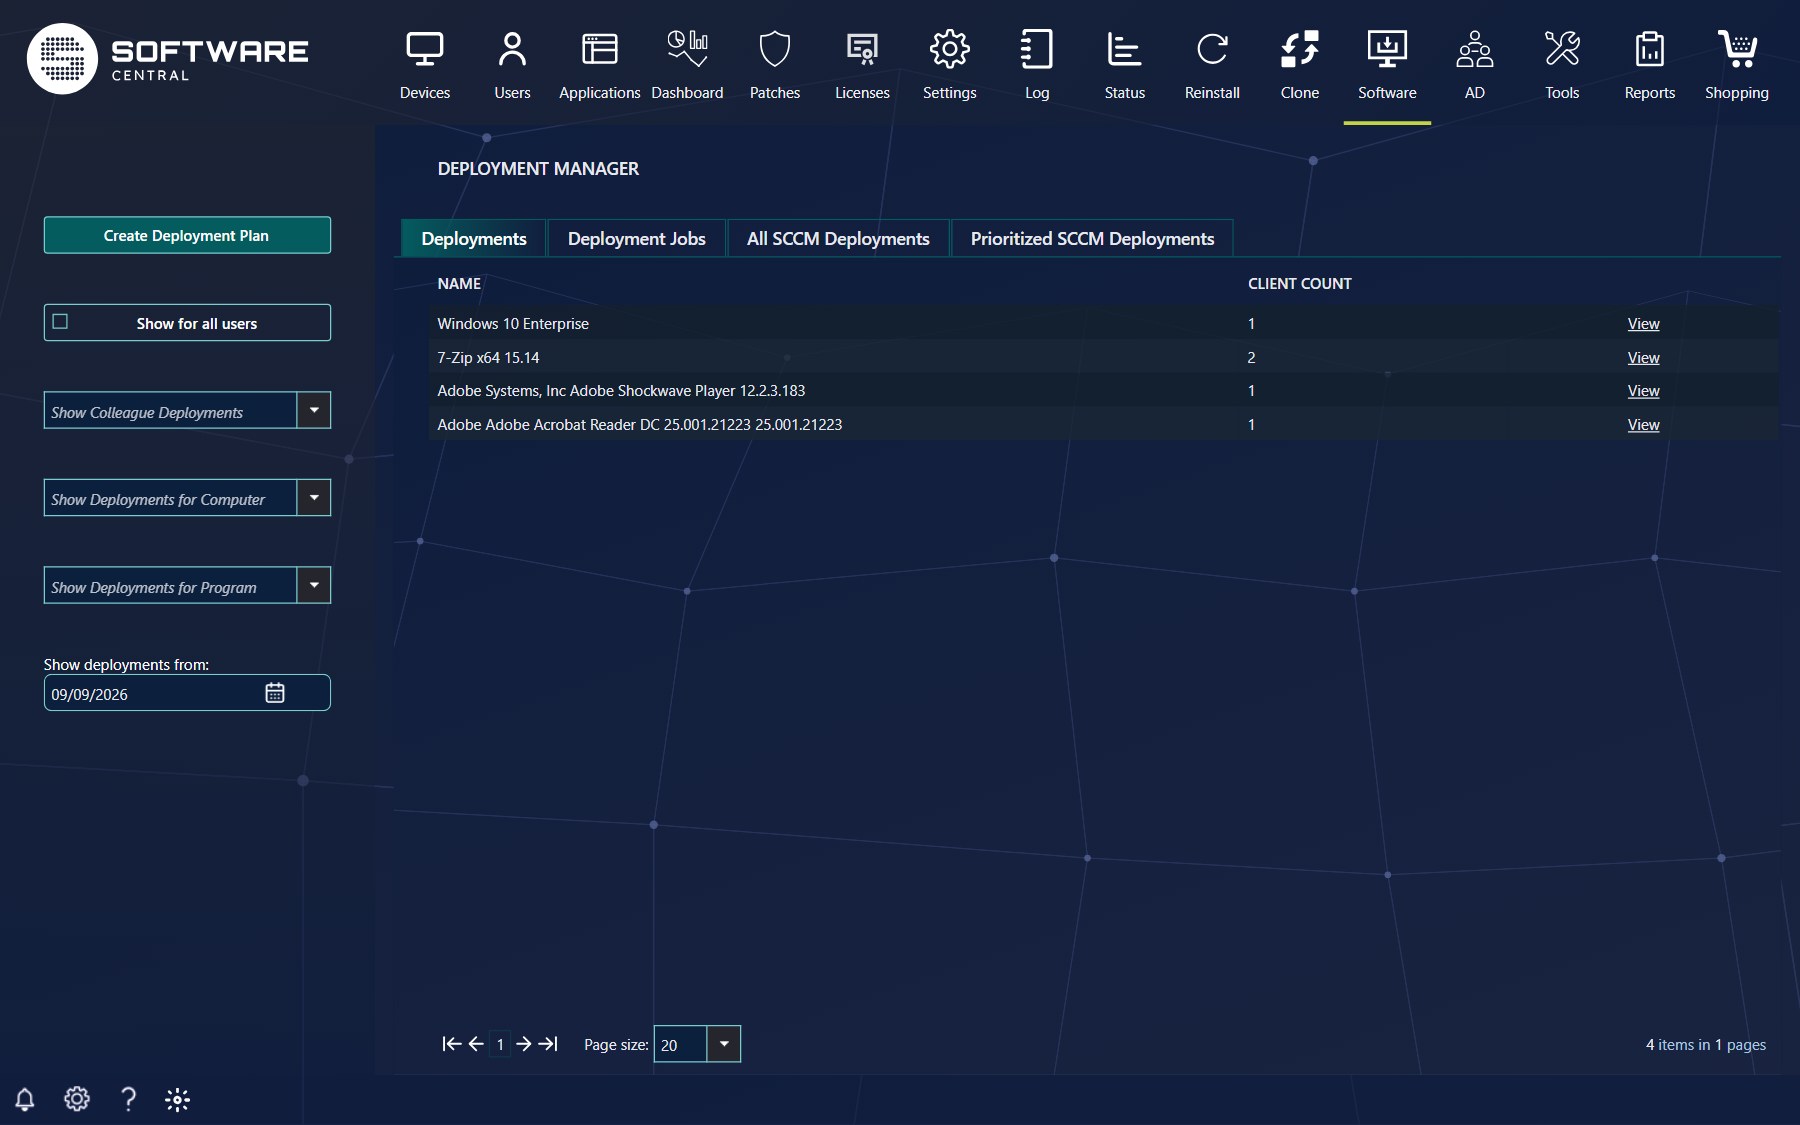
The main interface has the menu at the top. The available buttons in the menu may vary depending on your security role and the modules available in your company subscription.
When you click on a menu button, a sub menu will appear for all buttons except the log. The log button goes directly to the log.
The interface will adapt to your window and screen size.
The shopping menu is described in Menu Overview.
3 Footer buttons
Below the main interface you find the footer buttons in the lower left corner: Deployment Monitor, Notifications, Settings and Help. Two more buttons can appear: a theme switch for light and dark mode, and the Intune sign-in.
| Button | When you see it |
|---|---|
| Deployment Monitor | Only for users with access to the Deployment Manager, and only when the Deployment Monitor is enabled in Settings. See section 4. |
| Notifications | Unless notifications are disabled in Settings. Tooltip: Show Recent Notifications. See section 5. |
| Settings | Always. Tooltip: Settings. See section 6. |
| Help | Always. Tooltip: Help. See section 7. |
| Theme switch | Switches between light and dark mode. |
| Sign in to Intune | Shown when the Intune sign-in is used. Tooltip: Sign in to Intune; after signing in, the tooltip is Sign out from Intune. |

4 Deployment Monitor
In the lower left corner, you have the Show Deployment Monitor button. This button opens a small window that shows a list of your last deployments and their deployment status. The deployment monitor is only visible for users with access to the deployment manager.
The deployments are sorted after the time they were deployed. The three columns to the right display the number of succeeded, pending / unknown and failed deployments.
You can click on each number to get an overview of the clients with status messages. The overview opens in a new window.
In the top of the deployment monitor, you can choose between deployments made Today, Yesterday and Last Week.
The View All button will redirect to the deployment manager where you can see all deployments.
The Refresh button will reload the status for the deployments.


5 Notifications
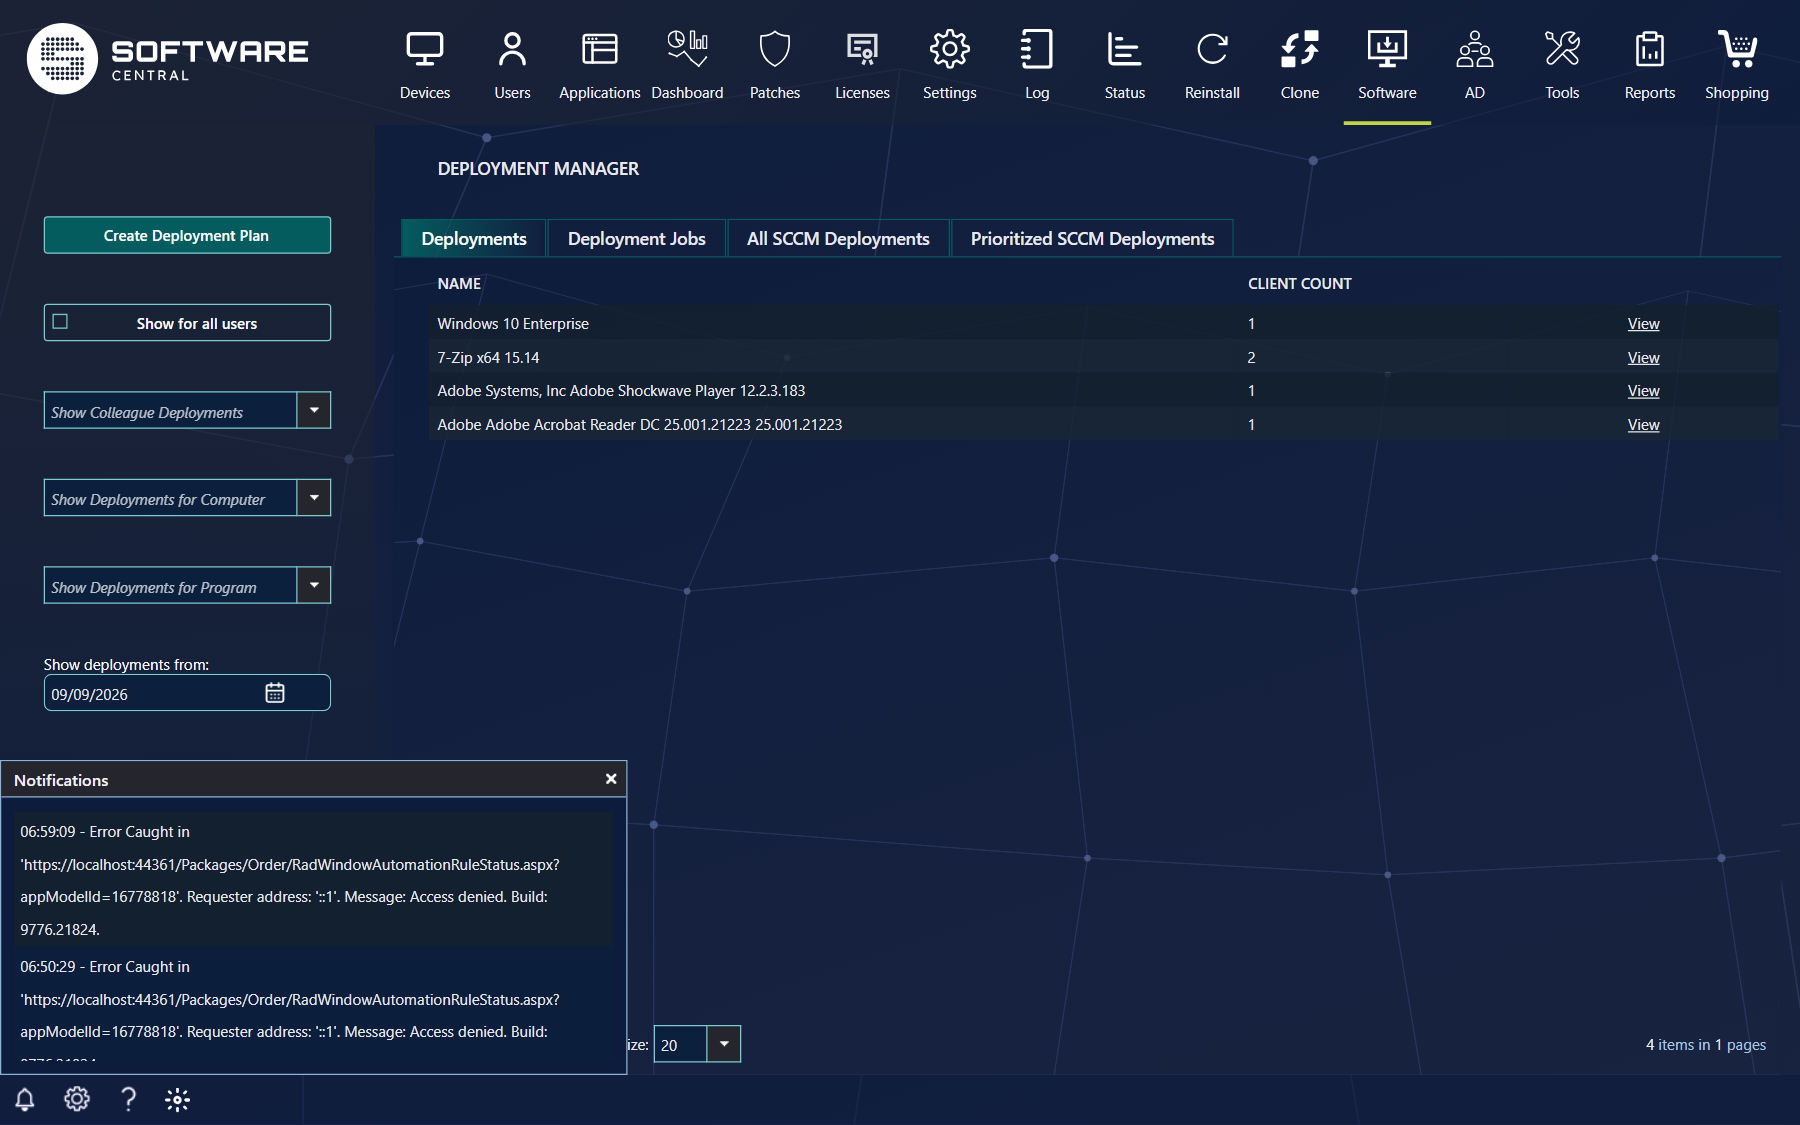
In the lower left corner, you have the notification popup. You can use the notification popup to view if an action goes good or bad.
You can view all notifications from the Log.
6 Settings
Click on the gears icon to open the Settings popup.
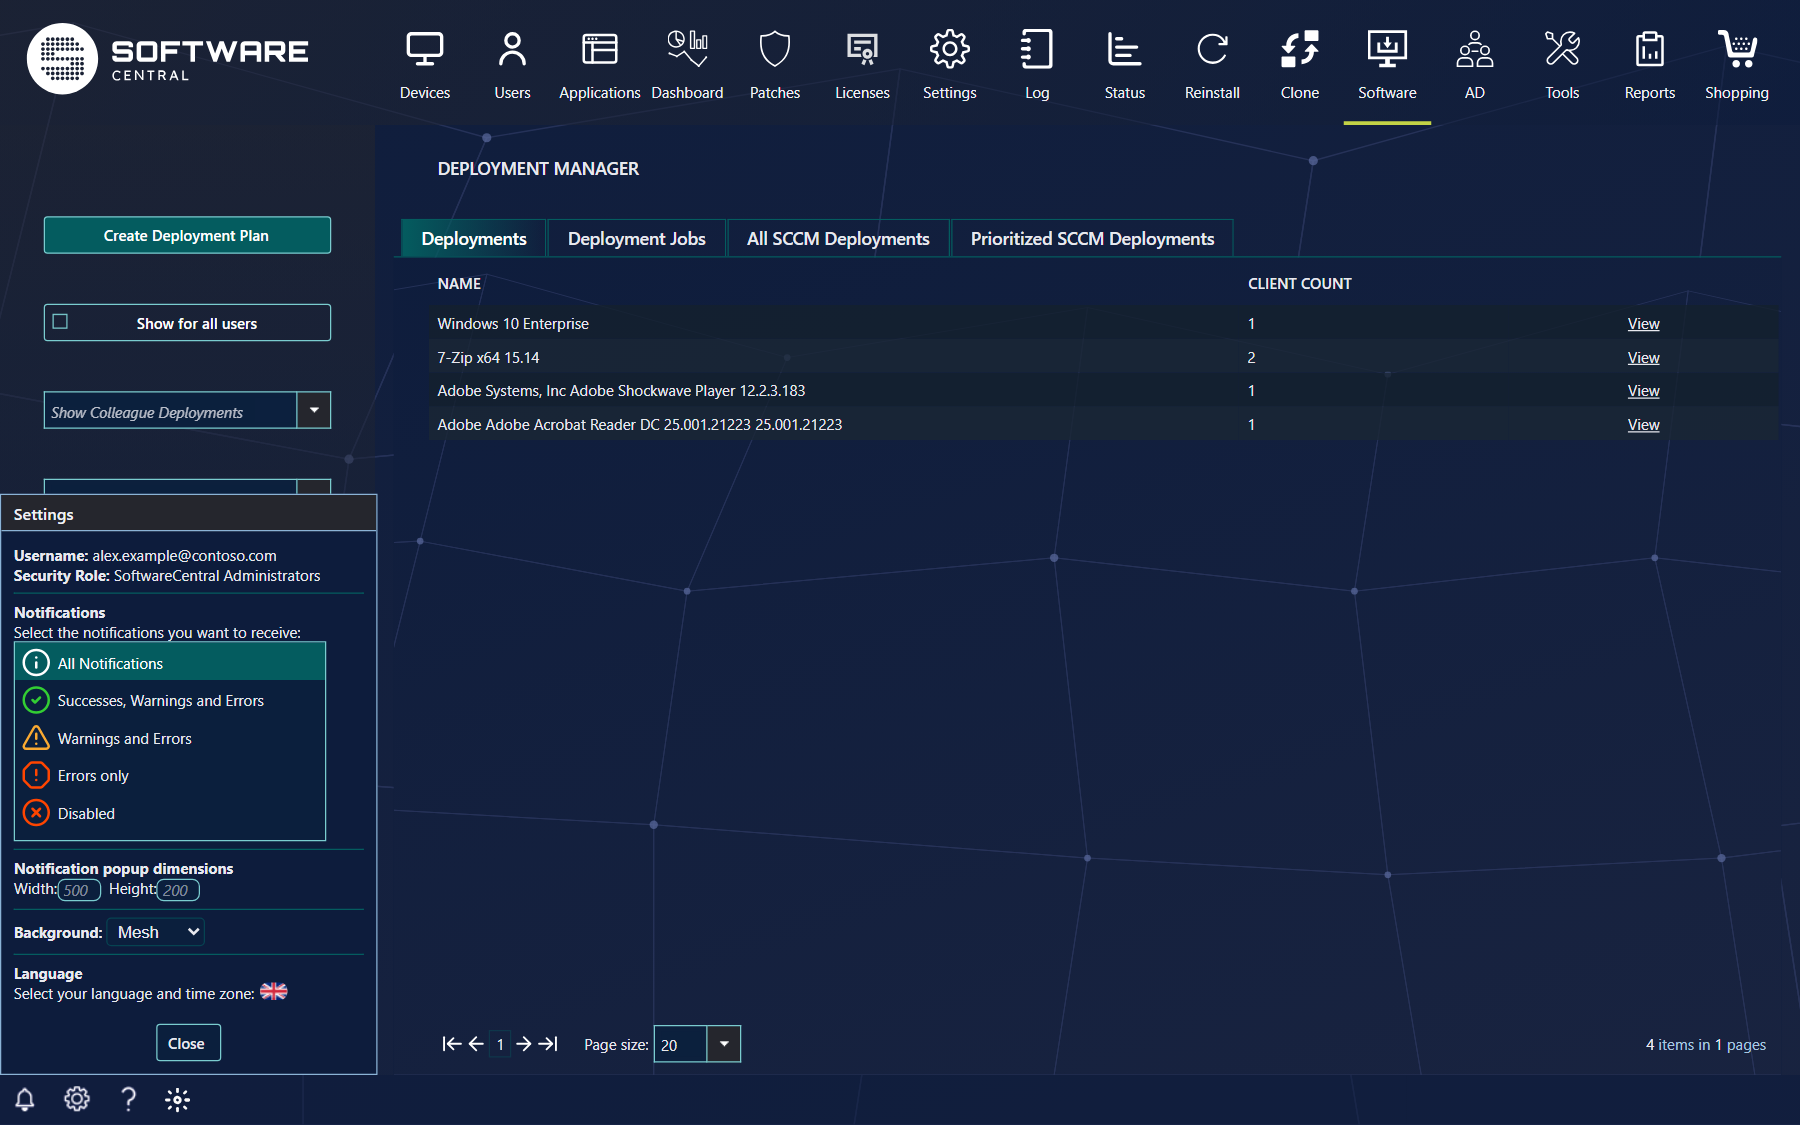
The popup shows your username and your security role. Select the notification types you want.
| Choice | What it does |
|---|---|
| All Notifications | Shows all notifications. |
| Successes, Warnings and Errors | Removes general information, start and end tags. |
| Warnings and Errors | Only shows warnings and errors. |
| Errors only | Only shows error messages. |
| Disabled | No notifications will show. |
Notification popup dimensions sets the width and height of the popup in pixels (100 to 1000). The size is saved in a cookie in your browser, so it applies to that browser only. The default size is set by an administrator under Settings, SoftwareCentral, Interface Settings.
Choose to auto-show the Deployment Monitor: tick Automatically show the Deployment Monitor. When it is ticked, the Deployment Monitor opens when a new deployment is initiated. The checkbox is shown only when the Deployment Monitor is available to you.
Select your language and time zone under Language. It is important to select your correct time zone when you make scheduled deployments and jobs on devices in other time zones.
Click Close to close the popup.
7 Help
The Help button will open this guide in a web based form.
8 Best practice
- Set your time zone before you schedule anything. Scheduled times are read in the time zone of your user, and the phased deployment window shows that zone.
- Set the auto-show and the notification size in each browser. Both are kept in a cookie in that browser, so they do not follow you to another browser or computer.
9 Troubleshooting
| Symptom | Cause | What to do |
|---|---|---|
| There is no Show Deployment Monitor button and no auto-show checkbox. | Your role has no Deployment Manager button, or the Deployment Monitor is turned off in Settings, or this is an Intune-only installation. | Ask your SoftwareCentral administrator. |
| There is no bell in the footer, and no notification popup. | Disable notifications is ticked in Settings. | Clear the Disable notifications checkbox in Settings. |
| The notification popup has the default size in another browser. | The width and height are kept in a cookie for each browser. | Set the width and height again in that browser. |